
Article 2: Stop Guessing at Root Causes
Take the defined gap and develop competing, testable explanations.
Domain 1. Article 2.
By Edwin Angulo | Co-Founder, Angulo & Morsa Legacy Consulting LLC
Published July 25, 2026 | Last reviewed July 25, 2026
EXECUTIVE TAKEAWAY
A recurring problem is evidence that something deserves investigation. It is not proof that management’s preferred explanation is correct. Before approving a major process, staffing, software, AI, pricing, or policy change, leaders should separate observation from conclusion, define a measurable outcome, compare competing explanations, and state what evidence would change their minds.
A customer complains that no one called back. Repeat business declines. Overtime increases. Employees say a new system is slowing them down. The owner concludes that the company needs different software, more staff, or stricter accountability.
The problem may be real. The proposed cause may even be correct. But the observation alone does not establish the cause. Several conditions may have changed at the same time: customer mix, pricing, lead sources, staffing, workload, service availability, training, competitive activity, or the way employees record information. Acting on the first plausible explanation can produce an expensive solution to the wrong problem.
The operating principle is simple:
A recurring business problem should be treated as a testable hypothesis, not a settled conclusion.
This is not an argument for turning every management decision into an academic research project. It is an argument for disciplined problem framing. The INFORMS Analytics Framework begins with the business question rather than the data or technical method, and Lean Six Sigma’s DMAIC structure similarly requires the problem to be defined and measured before causes are analyzed and improvements are implemented (American Society for Quality [ASQ], n.d.; INFORMS, 2025).
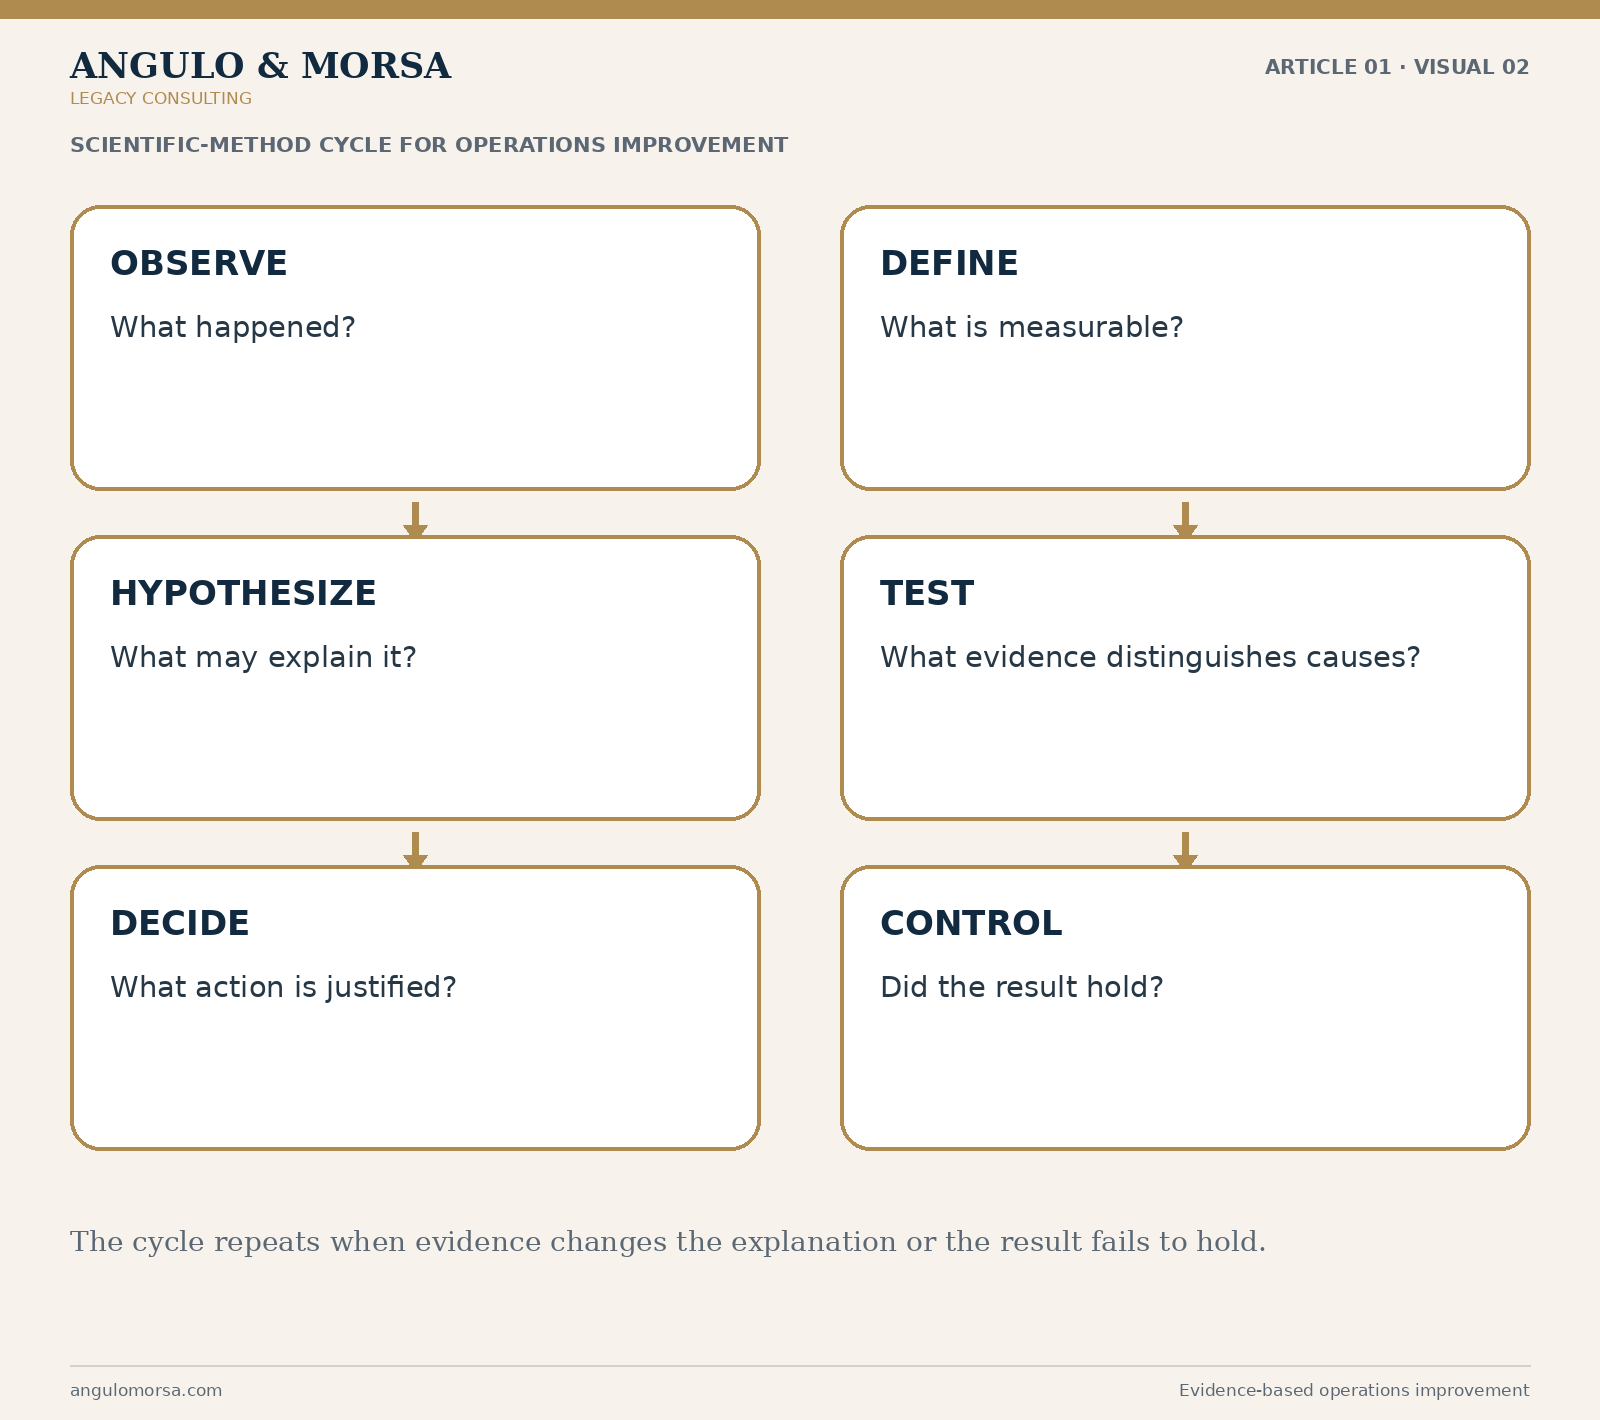
Figure 1. A practical scientific-method cycle for operations improvement.
Observation Is Not Conclusion
An observation describes what was directly detected or measured. A conclusion interprets why it happened. Confusing the two causes leaders to embed an untested theory inside the problem statement.
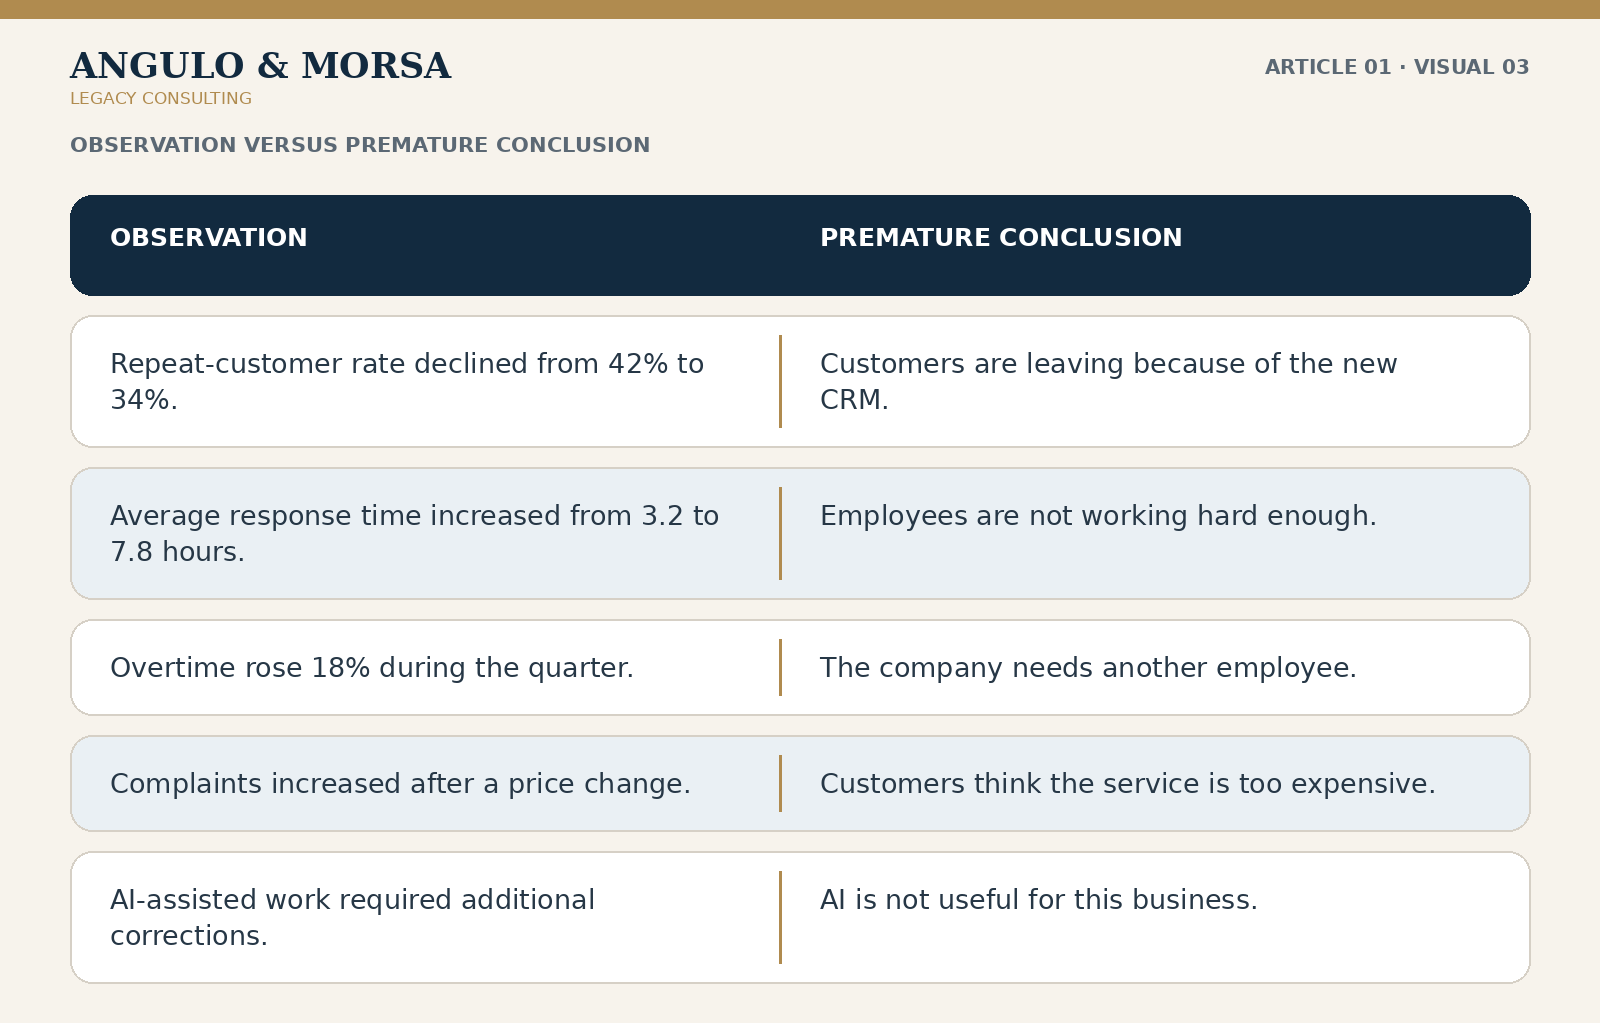
Figure 3. Observation Versus Premature Conclusion. Valid operational observations can lead to unsupported causal conclusions when management acts before testing alternative explanations.
A premature conclusion is not necessarily false. The problem is that it has not yet earned the status of a conclusion. Until the evidence distinguishes it from credible alternatives, it remains a hypothesis.
Observed result ≠ verified cause
Symptoms and Causes Exist at Different Levels of the System
Business symptoms are usually visible at the output of a process: lower revenue, missed deadlines, customer complaints, overtime, rework, refunds, reduced conversion, or increased owner intervention. The cause may begin much earlier in the workflow.
Input → Process behavior → Operational output → Customer or financial result
For example:
Incomplete intake information → clarification and rework → slower response → customer abandonment
The visible symptom is customer abandonment. Replacing the CRM may not help if the underlying problem is an unclear intake standard, inconsistent ownership, unavailable appointment capacity, or employees bypassing required fields. Conversely, retraining employees may not help if the software configuration itself creates unnecessary work.
DIAGNOSTIC PRINCIPLE
Do not ask only, “Where did the problem appear?” Ask, “Where in the system could this result have been created, amplified, or left undetected?”
Convert the Management Belief Into a Testable Business Question
A useful investigation starts with a specific decision-oriented question. “Is our process bad?” is too vague. “Are qualified inquiries contacted after 24 hours materially less likely to convert within 30 days than comparable inquiries contacted within 24 hours?” can be measured and challenged.
A strong business question identifies:
The process or decision under examination.
The measurable outcome that matters.
The suspected driver or exposure.
The relevant customers, transactions, employees, locations, or time period.
The management decision the analysis is intended to support.
This discipline matters because analytics can produce a technically correct answer to the wrong question. INFORMS (2025) emphasizes that analytics should begin with a clear statement of the business problem, not with a preferred software tool, model, or data set.
Define “Material” Before Looking at the Results
The initial statement below is directionally sound but not fully testable:
H₀: The current process is not materially contributing to customer loss.
H₁: The current process is materially contributing to customer loss.
The terms “current process,” “customer loss,” and “materially” must be operationally defined. Without those definitions, management can reinterpret the result after seeing the data.
A stronger example defines the elements in advance:
Process factor: Follow-up occurring more than 24 hours after a qualified inquiry.
Outcome: Conversion to a paying customer within 30 days.
Population: Qualified inquiries received during the previous 12 months.
Comparison: Timely versus delayed follow-up among reasonably comparable inquiries.
Materiality threshold: A conversion reduction greater than 5 percentage points.
Let pT represent the conversion rate for timely follow-up and pD represent the conversion rate for delayed follow-up. The operational hypotheses become:
H₀: pT − pD ≤ 0.05
H₁: pT − pD > 0.05
In plain language, the null hypothesis states that delayed follow-up is not associated with a conversion reduction greater than 5 percentage points. The alternative states that it is associated with a reduction greater than 5 percentage points.
This formulation deliberately separates statistical evidence from business importance. A tiny effect can be statistically detectable in a very large data set but financially irrelevant. A meaningful effect can also remain statistically uncertain when the sample is small or the process is highly variable. The American Statistical Association cautions that statistical significance does not measure effect size or practical importance and that decisions should not rest on a p-value alone (Wasserstein & Lazar, 2016).
The Null Hypothesis Is a Discipline, Not a Declaration That Nothing Is Wrong
Owners sometimes hear “null hypothesis” and assume the analyst is arguing that the process has no problem. That is not its purpose. The null provides a baseline that must be overcome by the evidence. It prevents the investigation from beginning with the preferred explanation treated as fact.
Rejecting the null means the evidence was sufficiently inconsistent with the defined null model under the chosen method and assumptions.
Failing to reject the null does not prove that no effect exists.
A result may remain inconclusive because the sample is too small, the data are noisy, the measurement system is weak, or the true effect is smaller than the materiality threshold.
The decision still requires effect size, uncertainty, cost, risk, feasibility, and operational context.
Falsifiability: What Result Would Show That the Explanation Is Wrong?
A hypothesis is useful only when evidence could contradict it. Scientific reasoning depends on claims that can be empirically tested rather than explanations that absorb every possible outcome (National Academies of Sciences, Engineering, and Medicine [NASEM], 2019).
These statements are difficult to test as written:
“The employees just do not care.”
“The economy is why sales are down.”
“Customers no longer value quality.”
“The software is probably creating hidden problems.”
“AI will eventually make this process better.”
A falsifiable version specifies an expected pattern:
TESTABLE VERSION
If delayed follow-up is materially contributing to customer loss, qualified inquiries contacted after 24 hours should convert at least 5 percentage points less often than comparable inquiries contacted within 24 hours.
The management team should then answer a harder question before reviewing results: What finding would cause us to abandon or substantially revise this explanation?
Compare Competing Explanations, Not Just “Our Theory” Versus “Nothing”
Real operational problems frequently have several plausible causes, and multiple causes may interact. A disciplined diagnostic compares them rather than collecting only evidence that supports the first theory.
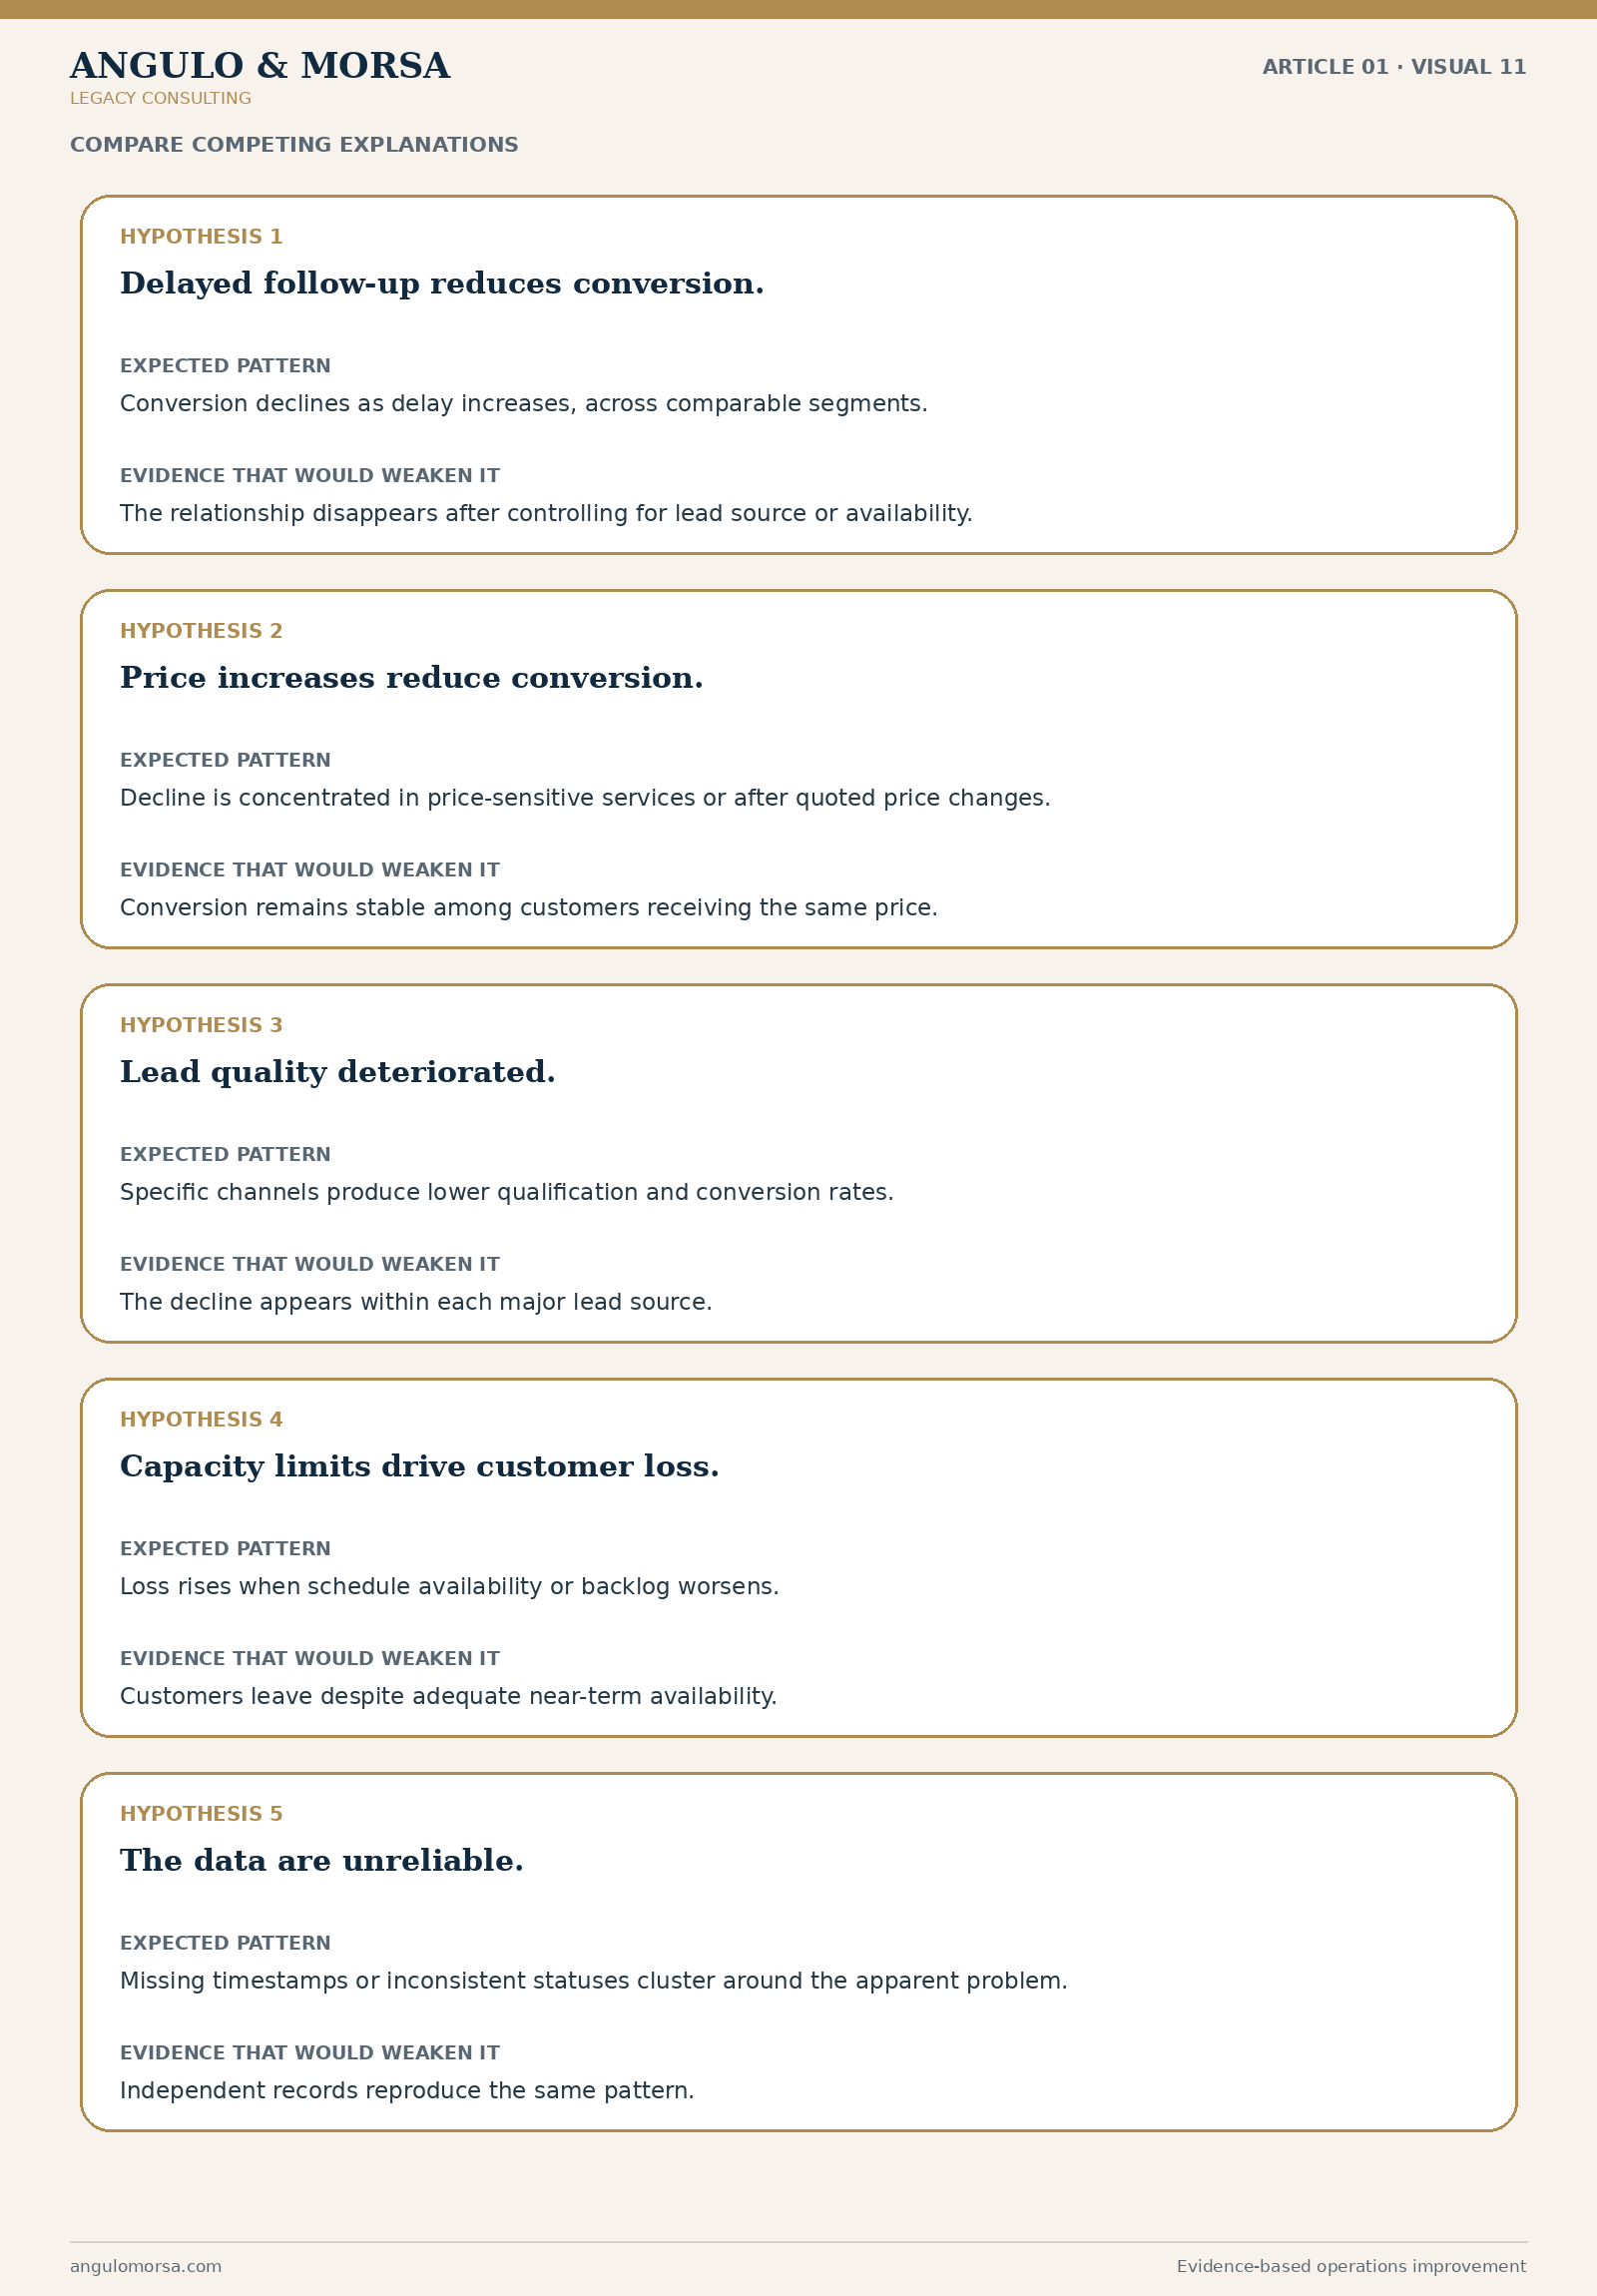
Figure 11. Competing Hypotheses for Declining Customer Conversion. Multiple plausible explanations are compared by suspected cause, expected pattern, and the evidence that would weaken each explanation.
The goal is not to produce the longest possible list. It is to identify the few explanations that are both plausible and consequential enough to affect the decision.
Confirmation Bias Turns a Hypothesis Into a Self-Protecting Story
Once leaders become attached to an explanation, the organization naturally starts searching for support and discounting contradiction. Hammond, Keeney, and Raiffa (1998) describe this as the confirming-evidence trap: decision makers give disproportionate weight to information that supports an existing belief.
The bias often appears in ordinary management activity:
Asking employees, “How is the CRM slowing you down?” instead of asking them to describe the workflow and failure points.
Reviewing only complaints that mention response delays.
Comparing only periods after a software implementation.
Excluding customers who converted despite delayed follow-up.
Measuring time saved while ignoring rework, exceptions, customer outcomes, or review effort.
Treating contradictory examples as unusual cases without testing whether they form a pattern.
Practical safeguards include writing the hypotheses and materiality threshold before analysis, documenting inclusion rules, identifying disconfirming evidence, segmenting the data, and assigning someone to challenge the preferred explanation.
Build an Evidence Plan Before Choosing the Solution
A strong evidence plan identifies the question, the data needed, the source, the reliability concern, and the decision the evidence can support. This aligns with DMAIC: define the problem, establish trustworthy measures, analyze causes, improve the process, and control the result (ASQ, n.d.).
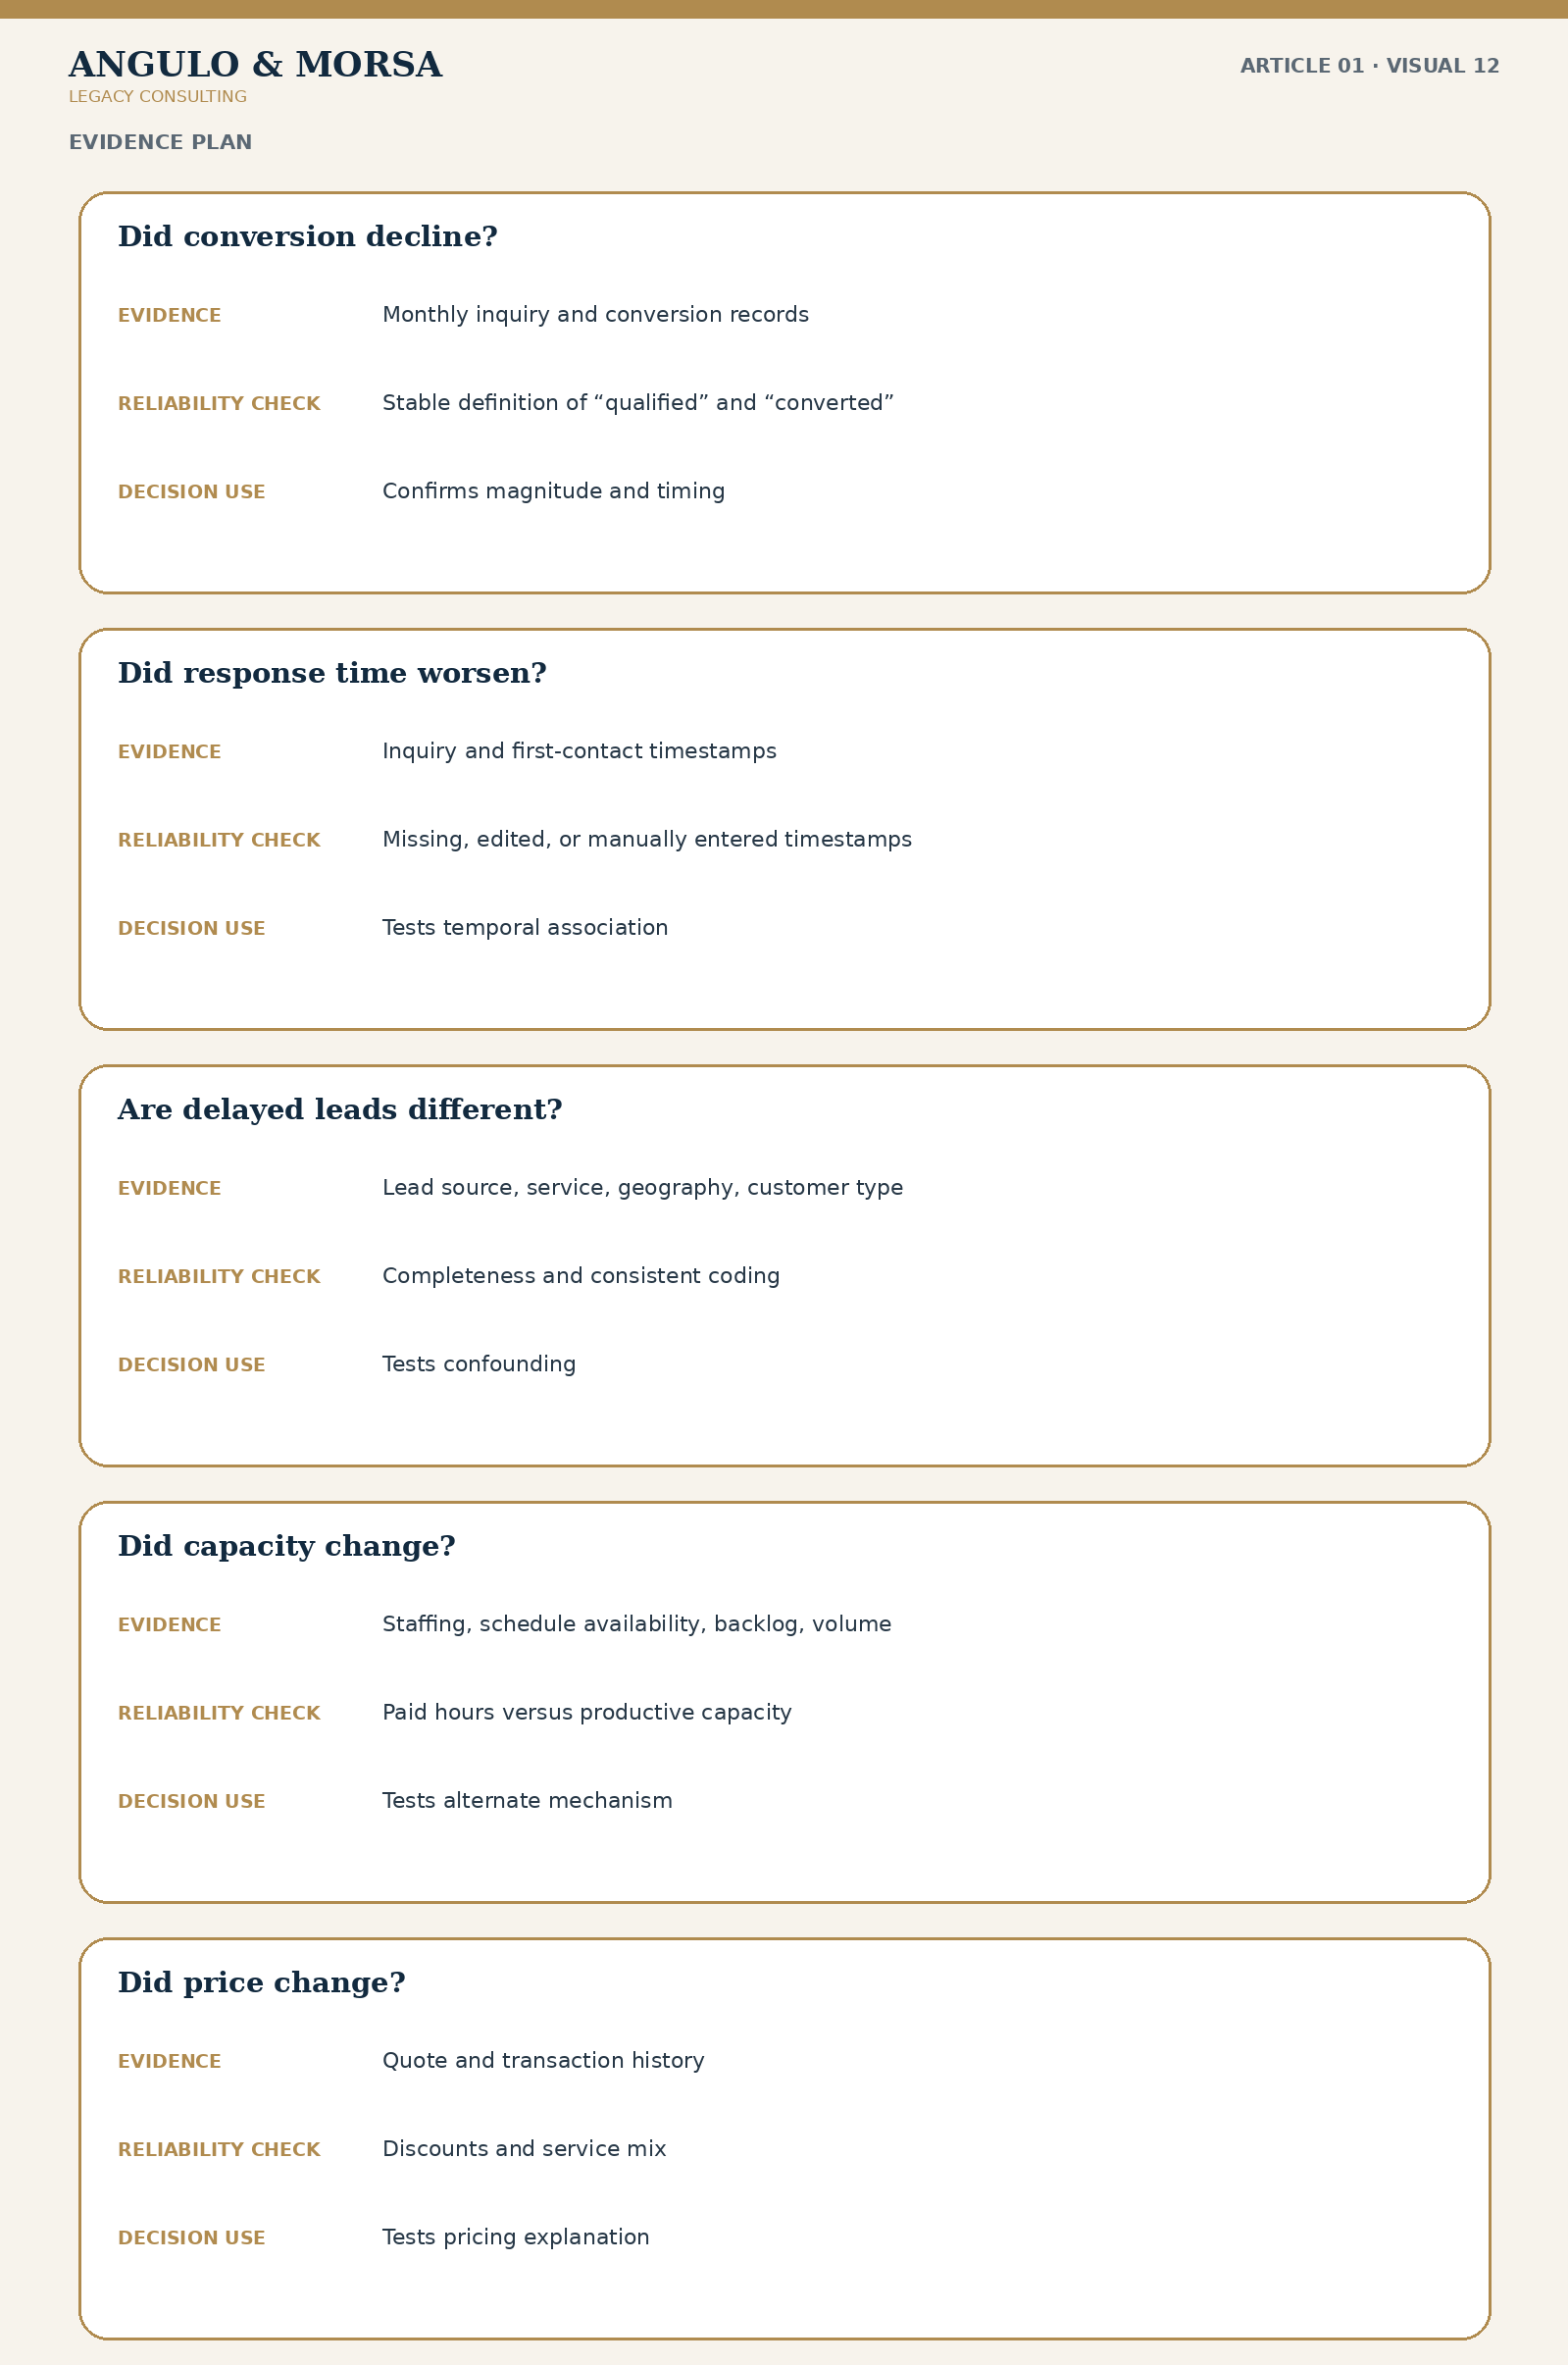
Figure 12. Evidence Plan for Operational Decision-Making. A structured framework linking each business question to the evidence required, the reliability checks needed, and the management decision the findings are meant to support.
Data quality is not a technical side issue. Missing timestamps, duplicate records, inconsistent status definitions, employee workarounds, and changed reporting rules can manufacture apparent performance changes. NASEM (2019) emphasizes transparent methods and clearly reported analytical conditions because confidence depends on whether others can understand and reproduce how the result was obtained.
Worked Example: A Meaningful Difference That Is Not Yet a Proven Cause
Assume a company reviews 2,000 qualified inquiries from the prior year:
1,000 inquiries received follow-up within 24 hours; 310 converted (31%).
1,000 inquiries received follow-up after 24 hours; 240 converted (24%).
Observed difference: 7 percentage points.
Observed difference = 31% − 24% = 7 percentage points
An approximate 95% confidence interval for the difference is 3.1 to 10.9 percentage points. The result provides evidence that the groups differ, but the interval includes effects below and above the company’s preselected 5-point materiality threshold.
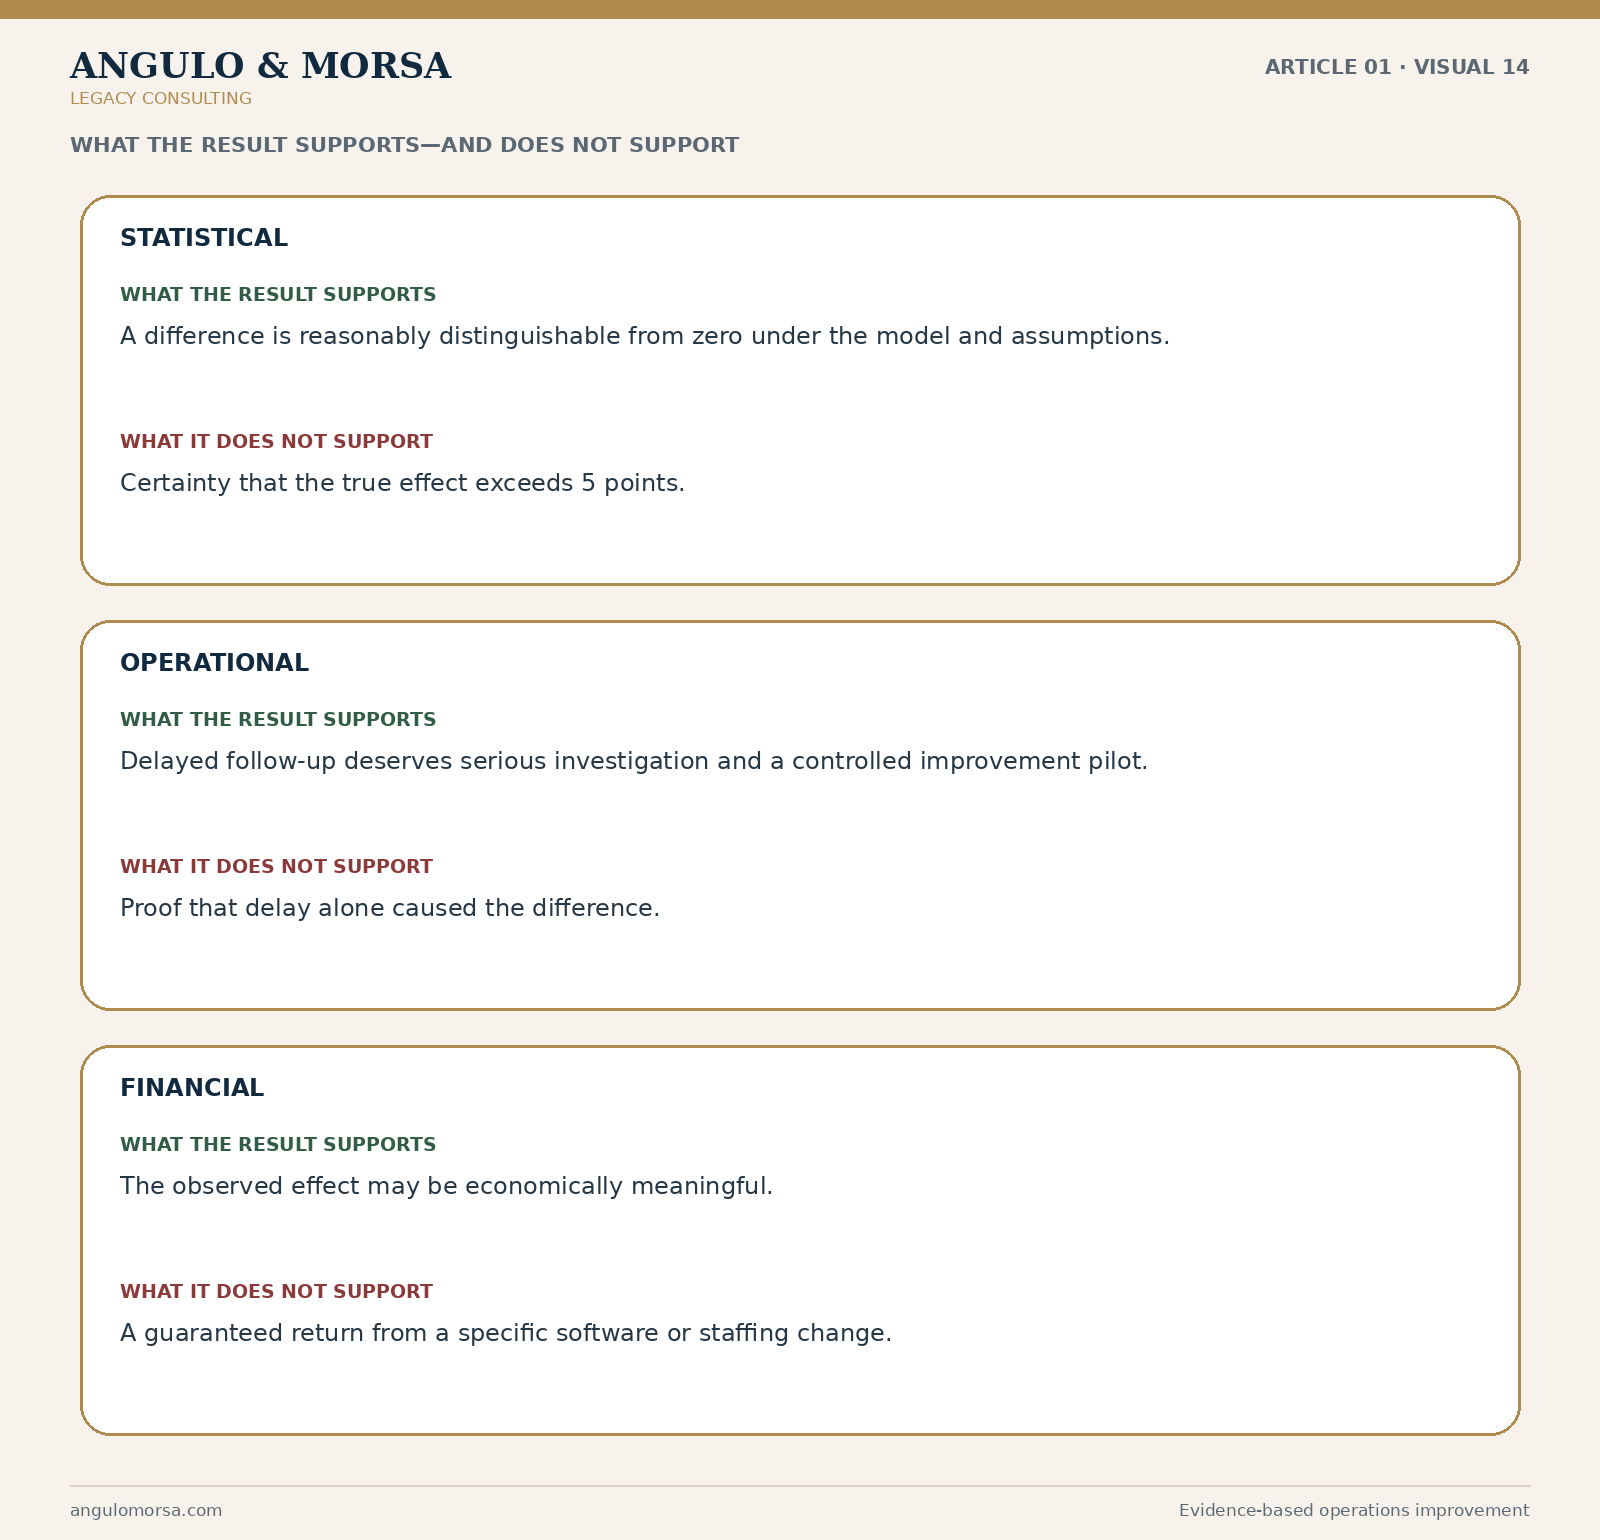
Image description: An Angulo & Morsa interpretation framework separating statistical, operational, and financial meaning. It shows what each type of result can support—such as evidence of a measurable difference, process relevance, or estimated business impact—and what it cannot establish on its own, including definitive causation, guaranteed results, or a complete management decision.
Suppose 600 qualified inquiries experience delayed follow-up each year and the average contribution margin per converted customer is $450. Using the observed 7-point difference:
600 × 0.07 × $450 = $18,900 estimated annual contribution-margin exposure
Using the confidence interval as a sensitivity range, the estimated exposure would be approximately $8,370 to $29,430. That range communicates uncertainty more honestly than a single-point estimate.
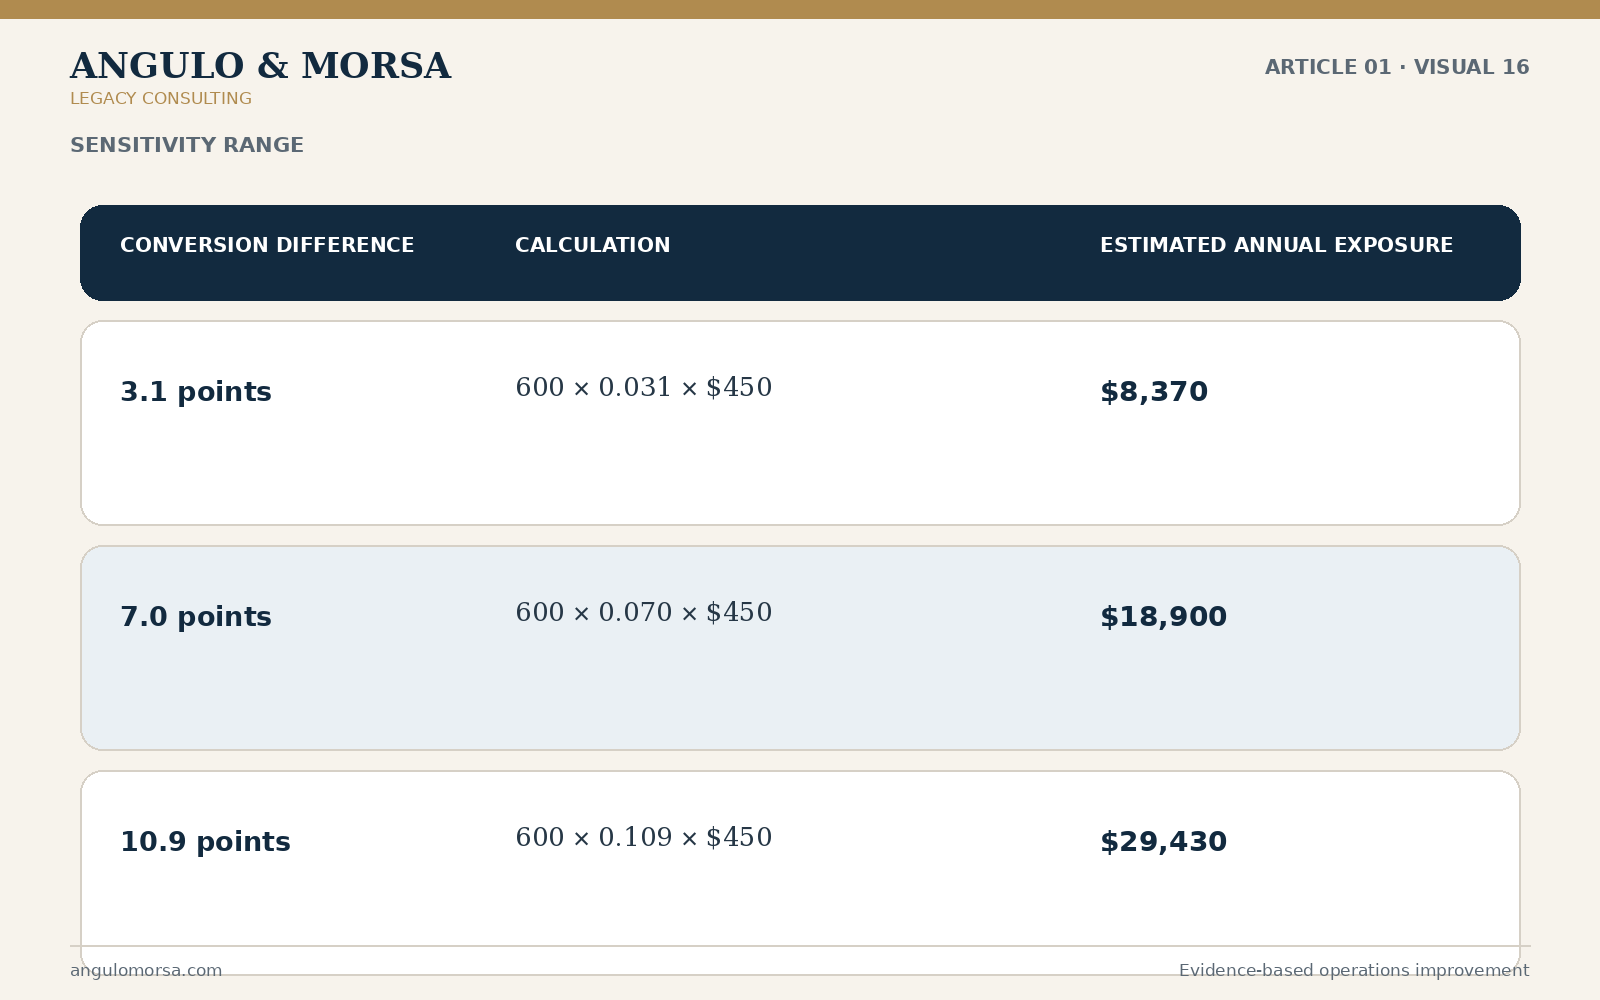
Figure 16. Sensitivity Analysis of Annual Contribution-Margin Exposure. Estimated annual contribution-margin exposure is compared under low, base, and high assumptions to show how different conversion-rate effects change the projected financial impact.
However, this is observational evidence. Delayed inquiries may differ in lead source, timing, service requested, customer urgency, or appointment availability. The correct next step is not automatically to purchase a new CRM or add staff. It may be to run a controlled pilot that improves follow-up for a defined group, confirms implementation fidelity, and measures whether conversion changes without increasing rework or reducing service quality.
State in Advance What Evidence Would Change the Conclusion
A credible analysis does not only explain what would support the preferred theory. It also identifies what would weaken or overturn it.
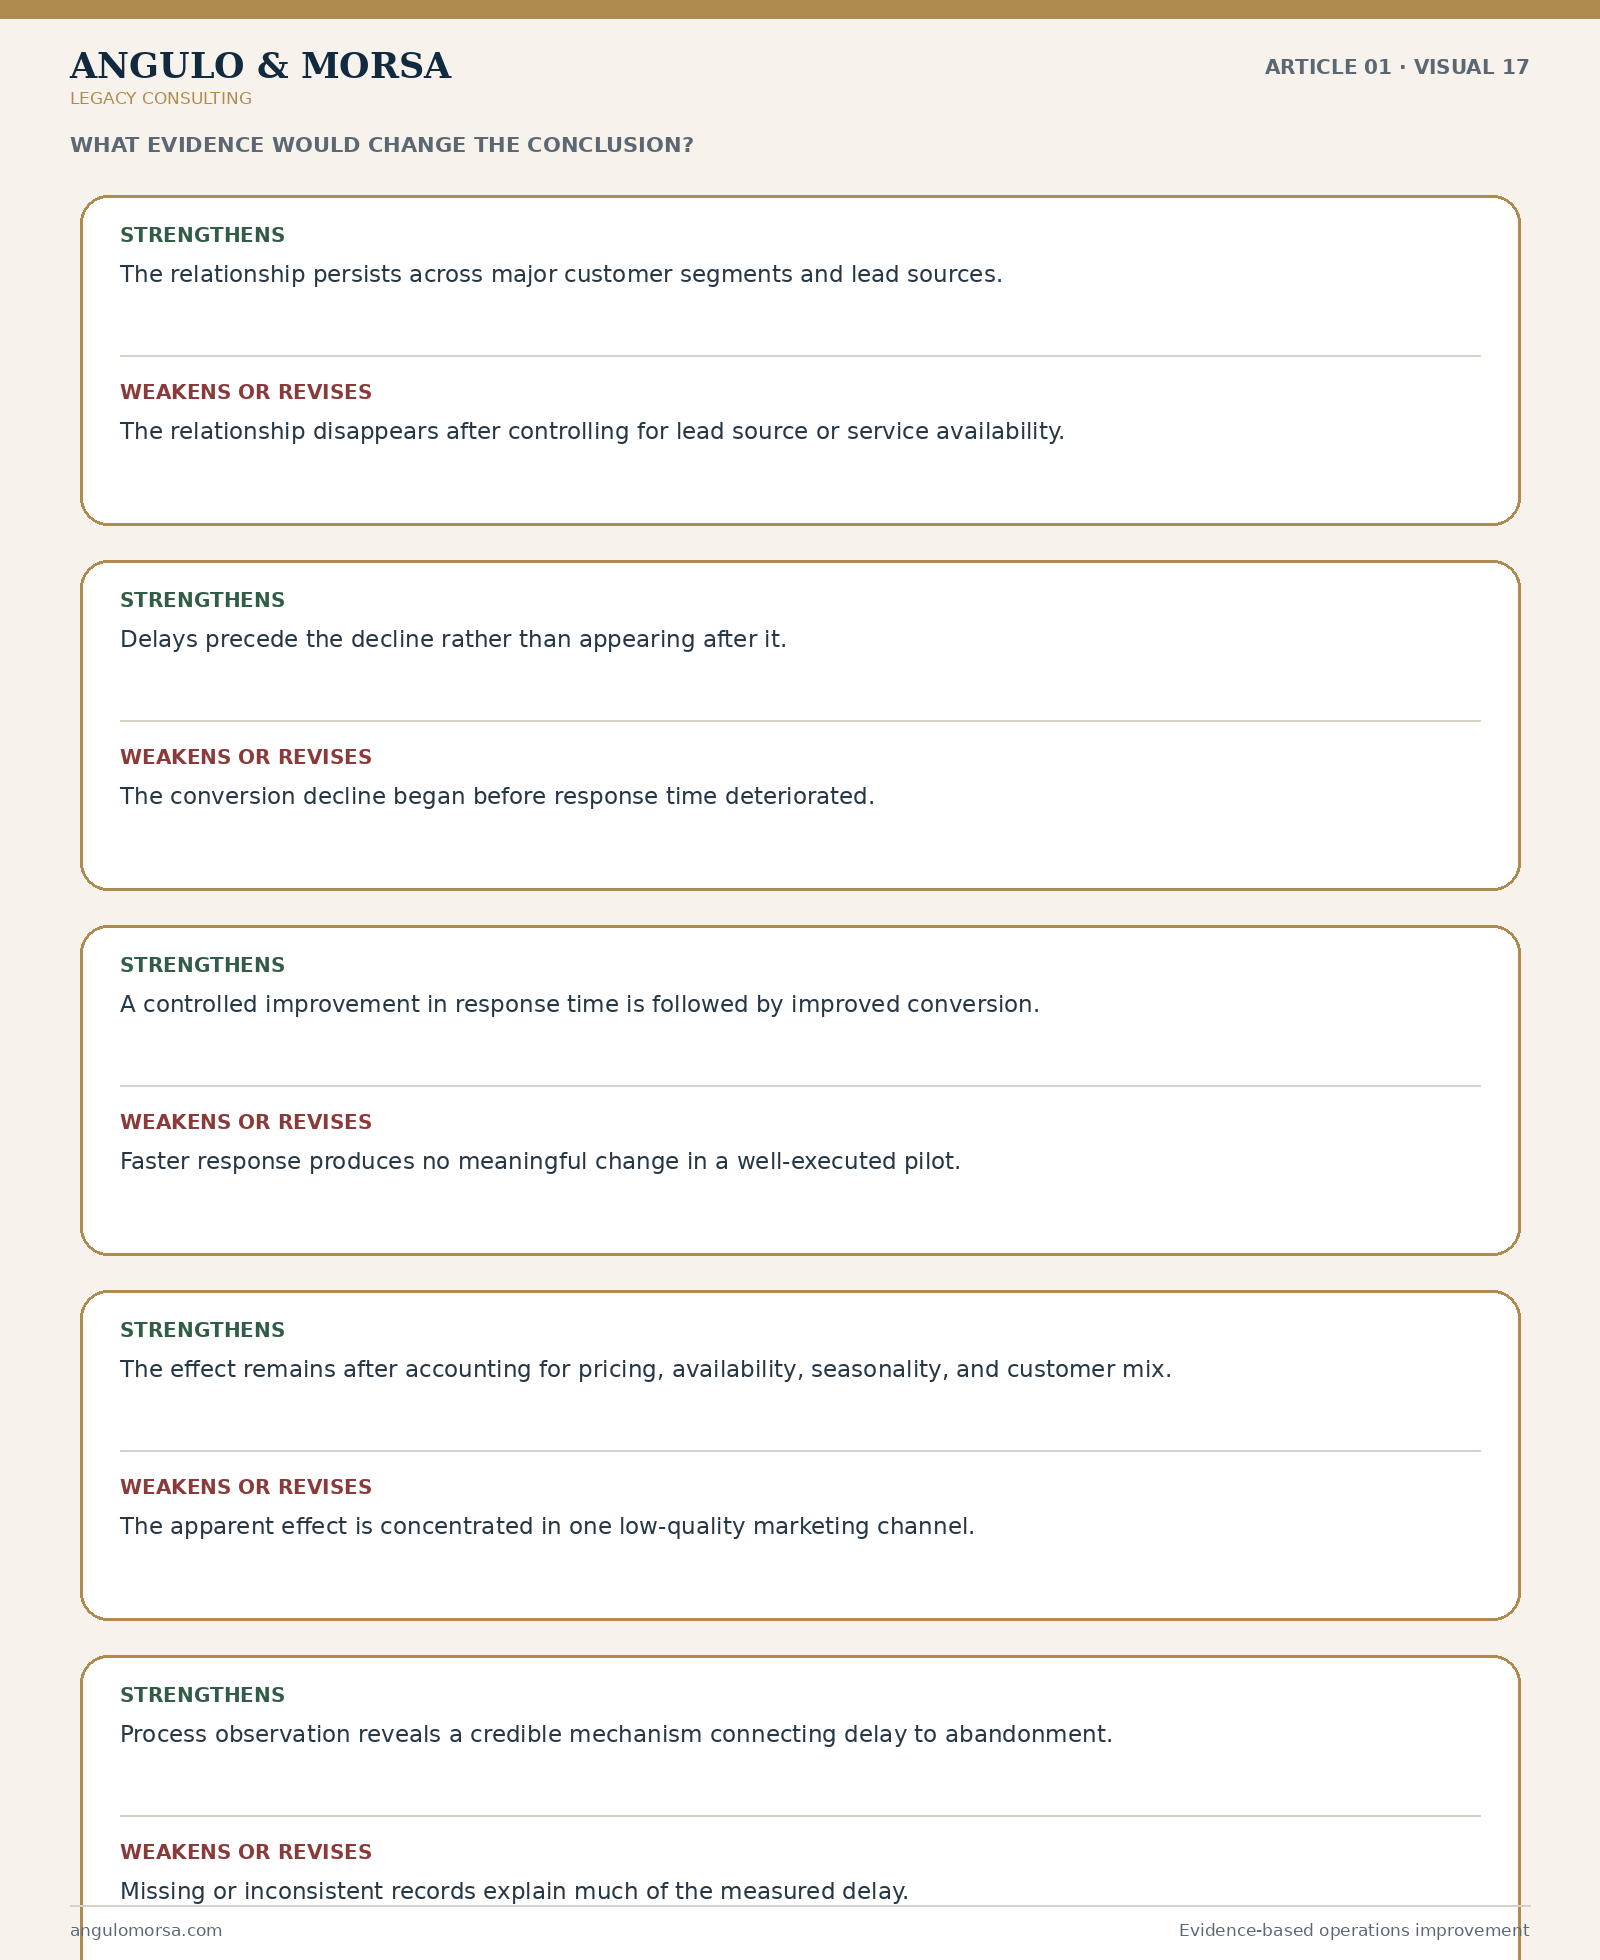
Figure 17. Evidence That Would Strengthen or Weaken the Hypothesis. Findings are separated into evidence that supports the delayed-follow-up explanation and evidence that would weaken, contradict, or require revising it.
Translate the Evidence Into a Decision Rule
The purpose of the analysis is not to produce a report. It is to determine which action is justified.
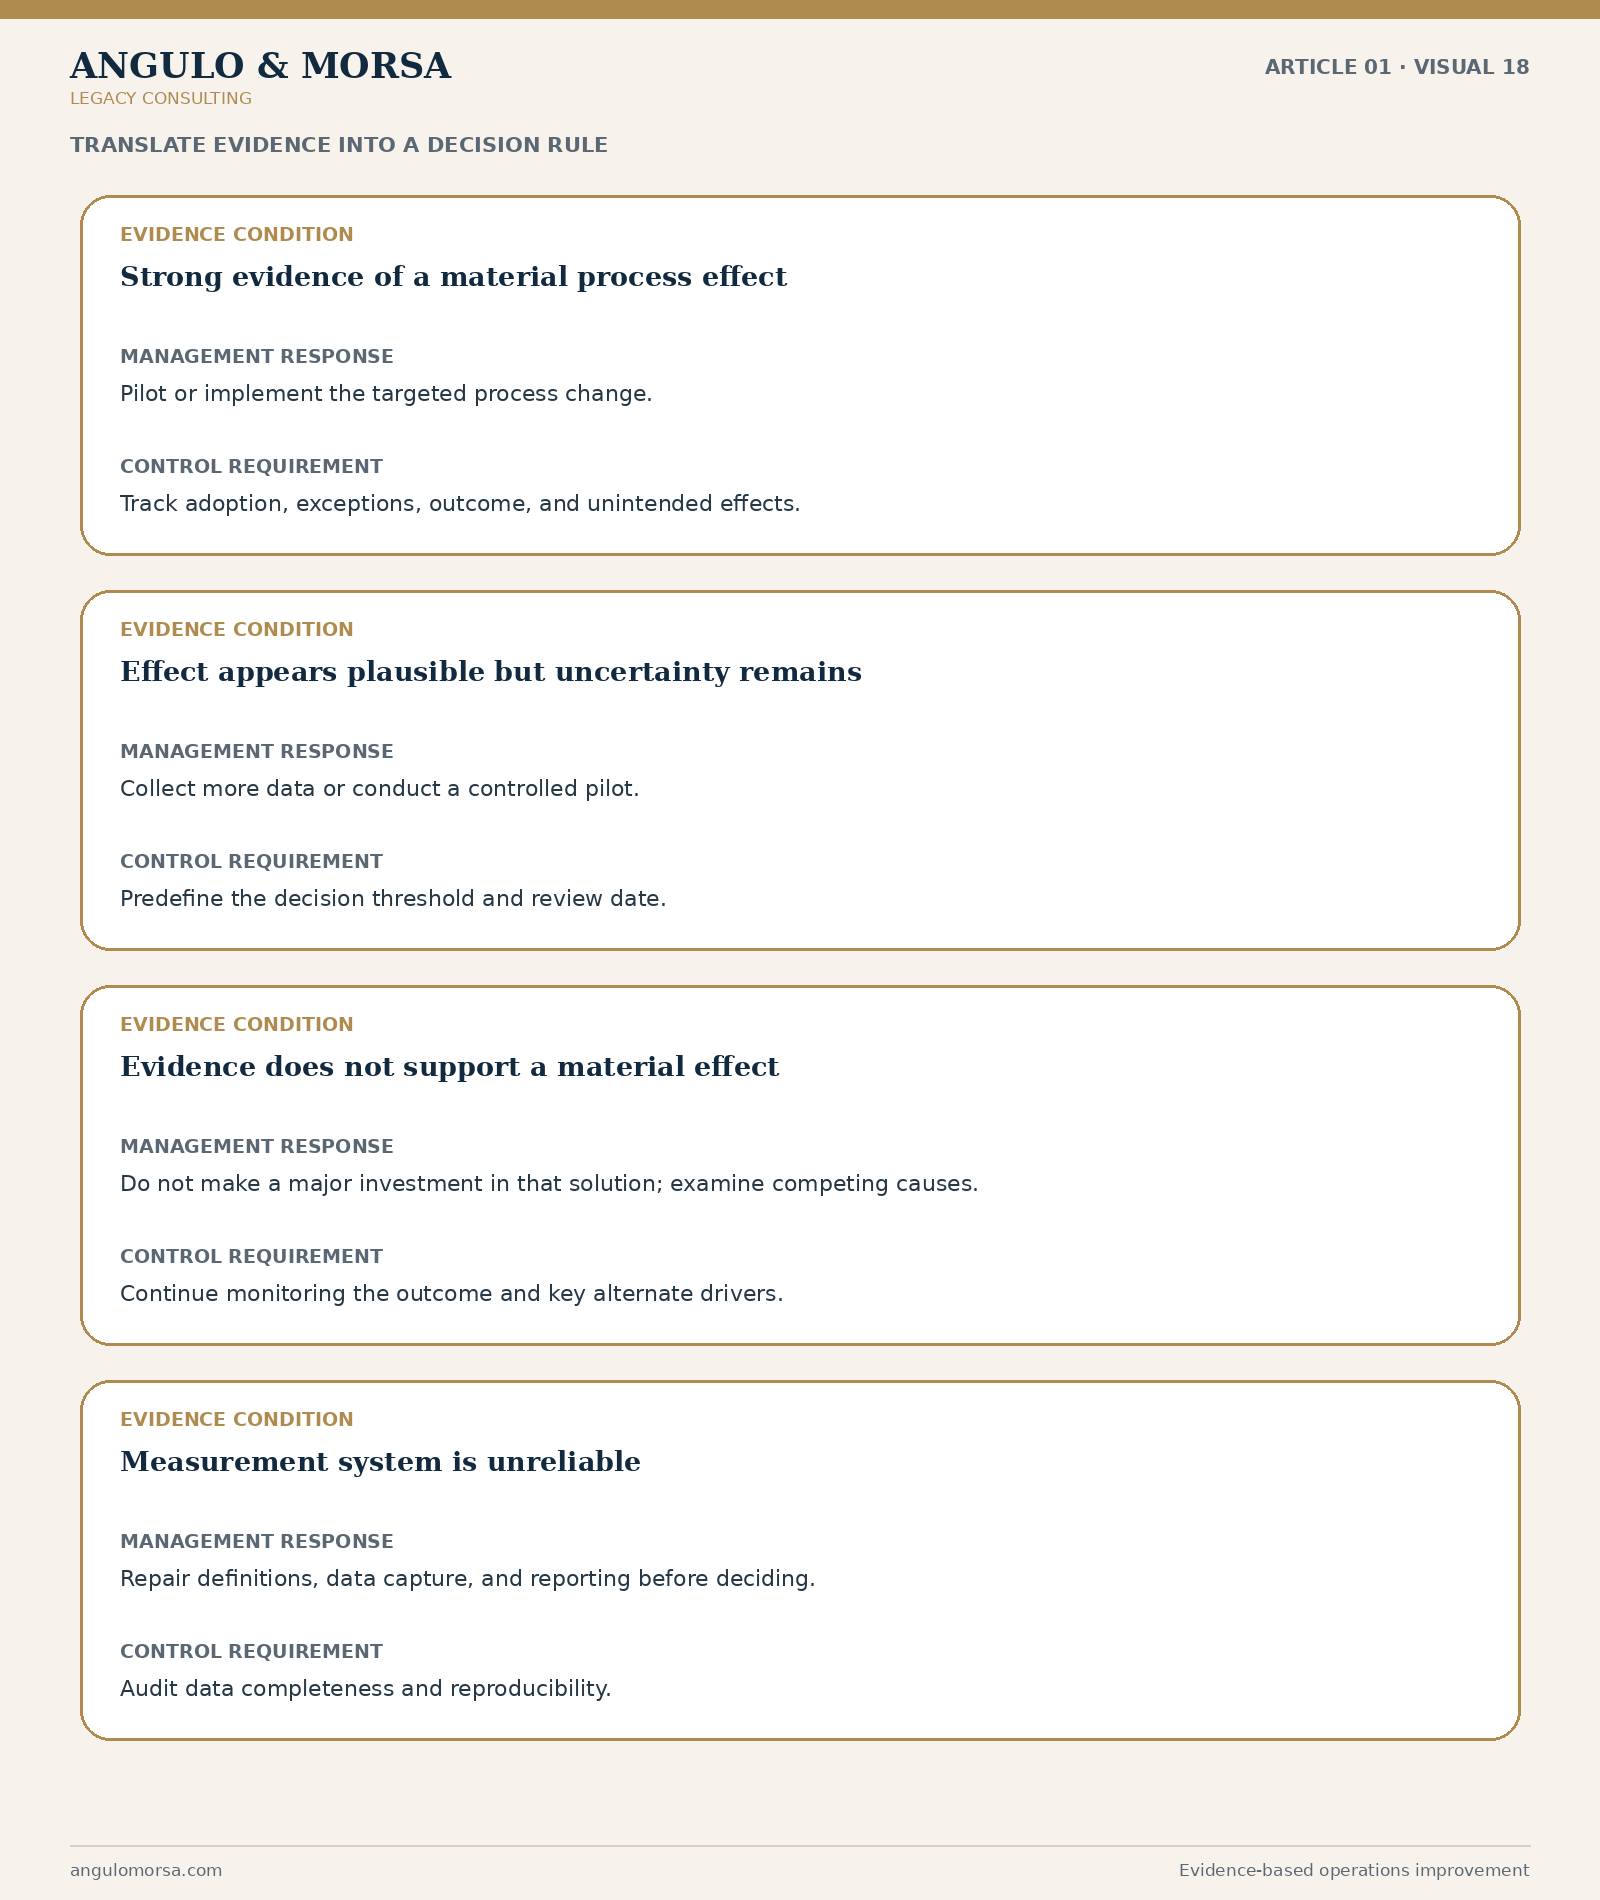
Figure 18. Evidence-Based Management Decision Framework. Four evidence conditions are linked to the appropriate response: implement, pilot, investigate alternatives, or repair the measurement system before acting.
The Eight-Question Management Test
Before approving a major operational change, leadership should be able to answer these questions in writing:
What exactly was observed, and how was it measured?
What conclusion are we currently drawing from that observation?
What outcome variable matters to the customer or the economics of the business?
What effect size would be large enough to justify action?
What competing explanations could produce the same symptom?
What evidence would support, weaken, or overturn each explanation?
What are the data-quality, design, and statistical limitations?
What action will follow each possible result, and how will the result be controlled over time?
Conclusion: Urgency Should Increase Analytical Discipline
Recurring problems create pressure to act, particularly when customers, cash flow, employee capacity, or service quality are being affected. But urgency does not make the first explanation more reliable. Businesses often lose more money solving the wrong problem than they would have spent defining the right one.
A testable-hypothesis approach does not require perfect data or laboratory conditions. It requires management to be explicit: state what was observed, define what “material” means, identify plausible alternatives, specify the evidence needed, and acknowledge what would change the conclusion. That structure reduces confirmation bias, improves the quality of operational decisions, and creates a defensible bridge from diagnosis to implementation.
OPERATING RULE
No major process, staffing, software, AI, pricing, or policy change should be approved until management can state the observation, suspected cause, competing explanations, materiality threshold, required evidence, and result that would change the conclusion.
When Structured Diagnosis Becomes Appropriate
When a recurring operational problem has a meaningful customer, financial, employee, capacity, or management impact—and existing information does not establish the cause—Angulo & Morsa’s Operations Diagnostic examines how the work currently happens, the available evidence, the constraints, and the competing causes before recommendations are made.
Learn about the Angulo & Morsa Operations Diagnostic
Educational and Professional Disclaimer
This article is provided for general educational and informational purposes. It does not constitute legal, tax, accounting, financial, investment, human-resources, cybersecurity, regulatory, engineering, statistical, or other professional advice. Examples and calculations are illustrative and may not apply to a specific organization. Statistical methods depend on data quality, study design, assumptions, sample size, and context; qualified professional review may be appropriate for material decisions. Use of this article does not create a consultant-client or other professional relationship with Angulo & Morsa Legacy Consulting LLC.
References
American Society for Quality. (n.d.). DMAIC process: Define, measure, analyze, improve, control. https://asq.org/quality-resources/dmaic
Hammond, J. S., Keeney, R. L., & Raiffa, H. (1998). The hidden traps in decision making. Harvard Business Review, 76(5), 47–58. https://hbr.org/1998/09/the-hidden-traps-in-decision-making-2
INFORMS. (2025). INFORMS Analytics Framework. https://www.informs.org/Professional-Development/INFORMS-Analytics-Framework
National Academies of Sciences, Engineering, and Medicine. (2019). Reproducibility and replicability in science. The National Academies Press. https://doi.org/10.17226/25303
Prins, J. (2003). NIST/SEMATECH Engineering Statistics Handbook, Chapter 6: Process or product monitoring and control. National Institute of Standards and Technology. https://www.nist.gov/publications/nistsematech-engineering-statistics-handbook-chapter-6-process-or-product-monitoring
Wasserstein, R. L., & Lazar, N. A. (2016). The ASA statement on p-values: Context, process, and purpose. The American Statistician, 70(2), 129–133. https://doi.org/10.1080/00031305.2016.1154108
© 2026 Angulo & Morsa Legacy Consulting LLC. All rights reserved.